
How To Create a Pie Chart with Canvas (TK) ?

Post by Amina Delali, December 09th, 2021
Description
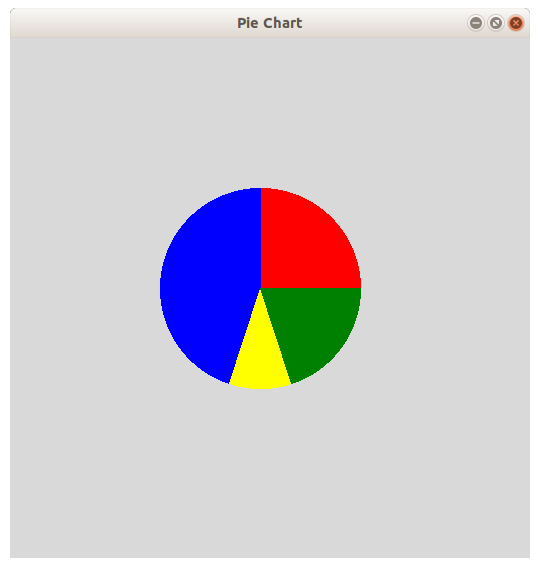
In this code I define a function "createPieChart" that creates a Pie Chart using Python and tkinter. Specially using canvas, and the create_arc function to create the slices of the Pie Chart. The function receives two parameters: the list of the percentages of the Pie Chart and the colors of the corresponding slices.
The Code
from tkinter import *
main_window = Tk()
main_window.title("Pie Chart")
main_window.geometry("520x520+300+200")
canvas = Canvas(main_window,width=500,height=500)
canvas.place(x=50,y=50)
def createPieChart(PieV,colV):
st = 0
coord = 100, 100, 300, 300
for val,col in zip(PieV,colV):
canvas.create_arc(coord,start=st,extent = val*3.6,fill=col,outline=col)
st = st + val*3.6
PieV=[25,45,10,20]
colV=["red","Blue","Yellow","Green"]
createPieChart(PieV,colV)
main_window.mainloop()
The Output
Something to say ?
If you want to add something about this post, please feel free to do it by commenting below 🙂.